A plotting diagram, also referred to as a “plot”, is a detailed visual representation of a diamond’s inclusions and blemishes. It is included in a diamond’s grading report and serves as a unique “fingerprint” of the stone, helping to identify and distinguish it from others.
Purpose and Importance
The plotting diagram illustrates the approximate size, location, and type of internal inclusions and external blemishes present in the diamond. Since no two diamonds have the exact same inclusion pattern, a plotting diagram provides a permanent record of a diamond’s unique characteristics. It is primarily used for:
Identification – Ensuring that the diamond matches its grading certificate.
Verification – Helping gemologists and jewelers confirm the stone’s authenticity.
Security – Assisting in tracking lost or stolen diamonds.
How It Works
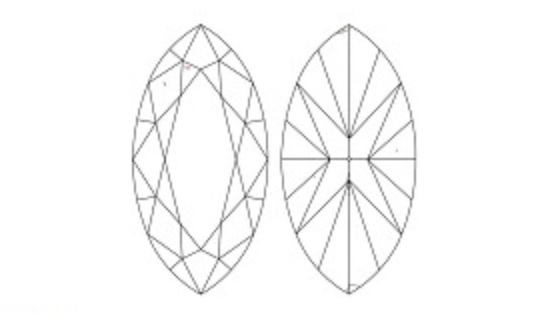
A plotting diagram typically consists of two diagrammatic views of the diamond:
Crown View (Top-Down Perspective) – Shows inclusions and blemishes on the top portion of the diamond.
Pavilion View (Bottom-Up Perspective) – Displays inclusions found on the lower portion of the stone.
Standardized symbols and colour codes are used to indicate different types of inclusions and blemishes. For example:
Red Marks – Represent internal inclusions such as pinpoints, feathers, or clouds.
Green Marks – Represent external blemishes such as scratches, pits, or polish lines.
Black Marks – May be used to indicate laser treatments or additional clarity enhancements.
Where It Is Used
Plotting diagrams are an essential component of diamond grading reports issued by reputable gemological laboratories such as:
GIA (Gemological Institute of America)
DCLA (Diamond Certification Laboratory of Australia)
HRD (Hoge Raad voor Diamant – Diamond High Council)
IGI (International Gemological Institute)
Limitations and Considerations
The diagram is an approximate representation, meaning it does not show the actual size or exact shape of inclusions.
Not all clarity characteristics are necessarily plotted—some labs omit very minor inclusions that do not affect the diamond’s clarity grade.
Certain diamonds, particularly those with very high clarity grades (e.g., IF – Internally Flawless), may have no markings at all on the diagram.
A plotting diagram is a crucial tool for identifying and evaluating a diamond, offering a visual roadmap of its clarity characteristics while ensuring transparency in the diamond grading process.